Overview
I built a flash Joule heating system to investigate graphene synthesis from carbon black. Brief electrical pulses rapidly heat and cool the feedstock, yielding approximately 100 mg of material per batch. Raman measurements show graphitic carbon with possible turbostratic character; confirming the layer structure remains a next step.
Experimental Setup
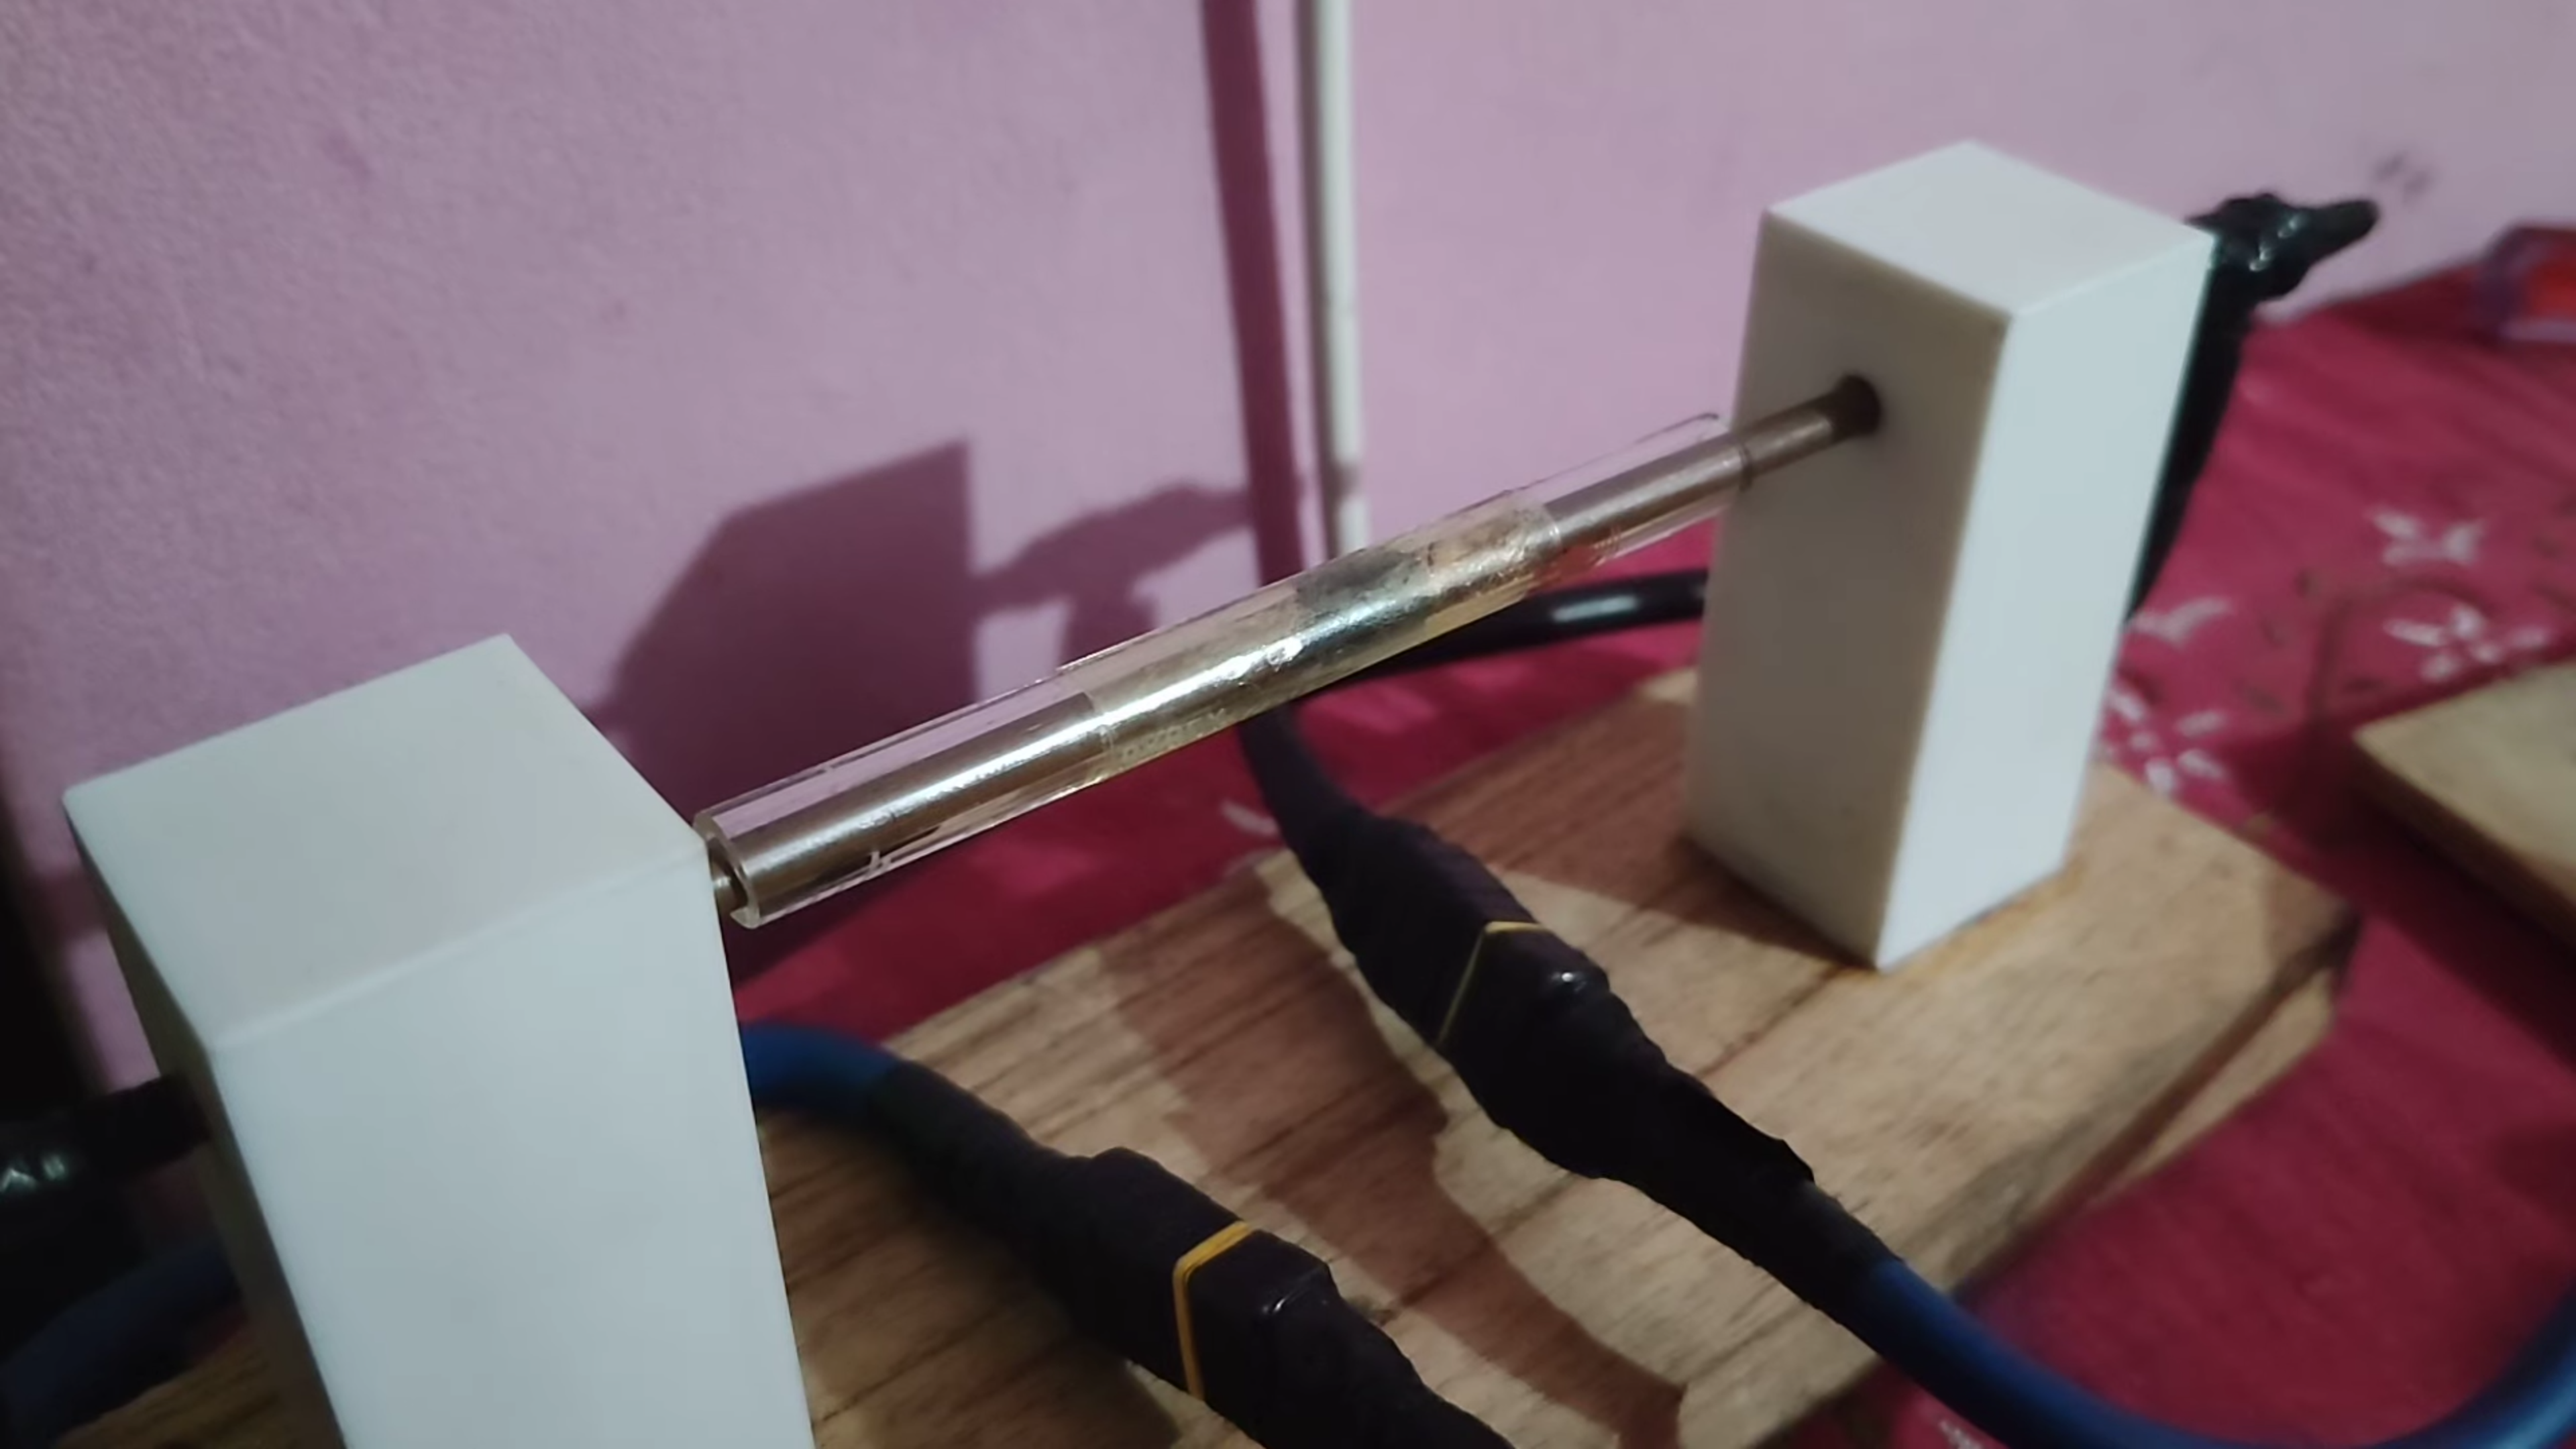

A custom AC–DC converter charges the capacitor bank, and an Arduino controls the discharge switch. Carbon black sits between copper electrodes in a quartz tube, where rapid heating to approximately 3,000 K is followed by rapid cooling.
- Capacitor bank
- 70 mF
- Charging voltage
- Up to 300 V DC
- Switch on-time
- ~30 ms
Experiment Video
Production & Raman Characterization
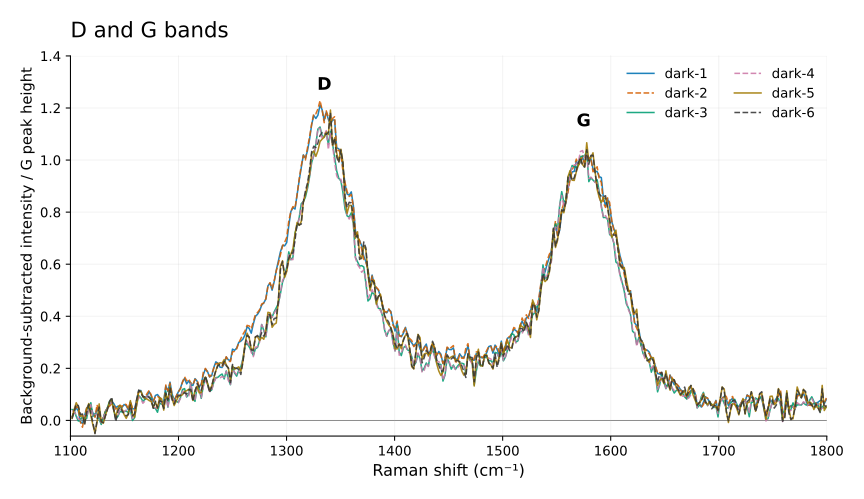
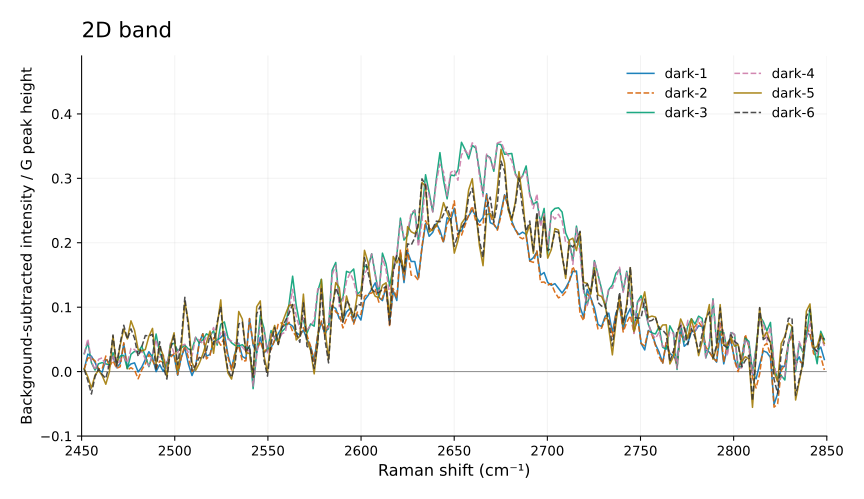
Six spectra show strong D and G bands and a weaker, broad 2D band, indicating disordered or edge-rich graphitic carbon. The 2D profile is compatible with turbostratic material but does not establish its stacking or layer count.
The spectra below use local background subtraction and normalization to the fitted G-peak height, without smoothing.
Peak measurements
| Spectrum | D center (cm−1) |
G center (cm−1) |
2D center (cm−1) |
2D FWHM (cm−1) |
ID/IG | I2D/IG |
|---|---|---|---|---|---|---|
| dark-1 | 1333 | 1576 | 2662 | 101 | 1.14 | 0.25 |
| dark-2 | 1333 | 1575 | 2662 | 99 | 1.15 | 0.25 |
| dark-3 | 1335 | 1573 | 2665 | 108 | 1.06 | 0.34 |
| dark-4 | 1335 | 1573 | 2665 | 106 | 1.06 | 0.34 |
| dark-5 | 1337 | 1576 | 2666 | 121 | 1.07 | 0.27 |
| dark-6 | 1337 | 1576 | 2667 | 118 | 1.07 | 0.27 |
FWHM: full width at half maximum. Ratios use fitted peak heights, not integrated areas; values depend on the background and fitting models.
Analysis method and limitations
Unsmoothed data were fitted with Lorentzian peaks and a linear background: two peaks over 1100–1800 cm−1 for D/G, and one over 2450–2850 cm−1 for 2D. Only the local background was subtracted.
A single-peak 2D model was favored in five of six spectra; the extra component in dark-6 did not establish a resolved peak. Alternative fits gave 2D widths of 95–127 cm−1, a sensitivity range rather than a confidence interval.
D′ was not fitted separately. Excitation wavelength and instrumental resolution were unavailable, and stacking-sensitive bands were unresolved. No layer count, defect dimensions, or turbostratic fraction can be inferred.
Next steps are higher-quality Raman measurements, microscopy and diffraction to verify layer stacking, and increased production capacity.